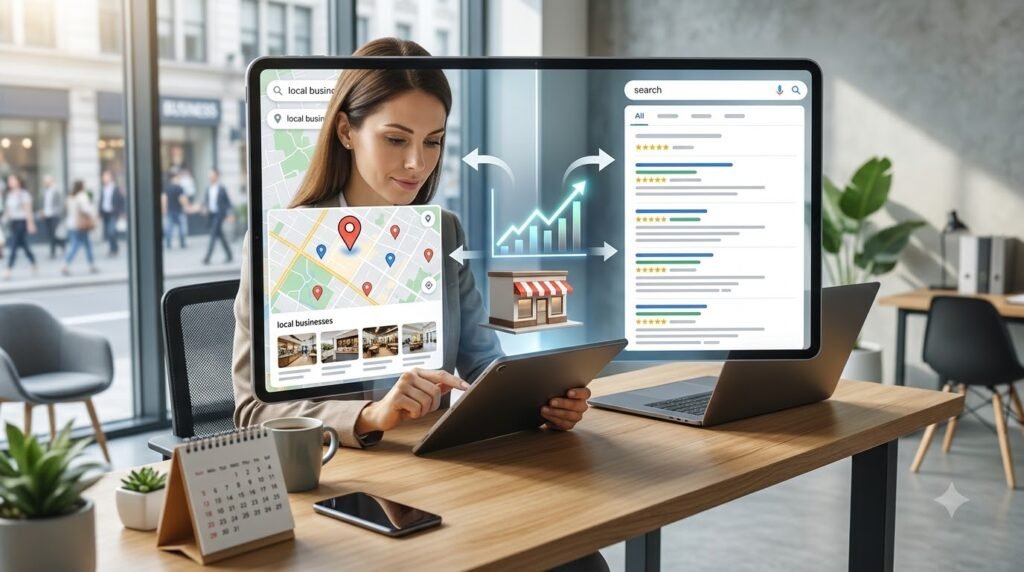
Your traffic graph is moving in the right direction.
Search impressions are increasing. Ads are generating clicks. More people are landing on your service pages.
Revenue, meanwhile, is sitting in the corner with its arms crossed.
When a local business has website traffic but no leads, the instinct is often to get even more traffic.
Publish more blogs.
Increase the ad budget.
Target more keywords.
Launch another campaign.
But pouring more visitors into a broken conversion journey can simply make the leak more expensive.
Traffic is only the beginning.
A potential customer still has to:
Find you → arrive on the right page → understand the offer → trust the business → take action → become a qualified lead → receive follow-up → become a customer
If any stage breaks, traffic can rise while revenue stays flat.
That is a conversion leak.
This guide walks through a seven-stage conversion leak audit designed for local businesses that are attracting attention but struggling to turn that attention into calls, appointments, qualified inquiries and revenue.
Quick Answer: Why Do I Have Website Traffic but No Leads?
If website traffic is increasing but leads or revenue are not, audit these seven areas:
- Measurement accuracy
- Traffic quality
- Search intent and landing-page match
- Message and offer clarity
- Trust and local credibility
- Conversion-path friction
- Lead response and sales handoff
Do not assume the website design is automatically the problem.
You may have:
- Leads that are not being tracked
- Traffic from the wrong audience
- Informational visitors being counted as buyers
- Service pages that do not explain the offer
- Weak trust signals
- Forms that people start but never finish
- Phone inquiries that are missed
- Leads that arrive but are never properly followed up
Start by finding where the journey breaks.
Then fix that stage before buying more traffic.
What Is a Conversion Leak?
A conversion leak is a point where a potential customer drops out before reaching the business outcome you want.
For a local business, a meaningful action may include:
- Calling
- Requesting a quote
- Booking an appointment
- Submitting a consultation form
- Starting a qualified chat
- Reserving a service
- Visiting the location
- Making a purchase
But the journey does not necessarily end when a form is submitted.
A more complete funnel looks like:
Traffic → Lead → Qualified Lead → Appointment → Sales Opportunity → Customer → Revenue
That distinction matters.
A business can have a perfectly healthy number of form submissions and still have weak revenue because most leads are unqualified or nobody follows up effectively.
Define What Counts as a Lead Before Auditing Anything
Before diagnosing performance, decide what each action actually means.
Not every website interaction has equal commercial value.
| Action | What It Usually Represents |
| Blog page view | Awareness |
| Service page view | Possible commercial interest |
| CTA click | Higher-intent interaction |
| Form start | Lead attempt |
| Form submission | Initial inquiry |
| Phone click | Attempt to contact |
| Connected call | Initial inquiry |
| Qualified inquiry | Potential customer fit |
| Booked appointment | Strong commercial action |
| Accepted proposal | Sales opportunity |
| Purchase | Customer |
The key phrase is usually represents.
Someone clicking a CTA is not automatically a customer.
Someone submitting a form is not automatically a qualified lead.
And someone tapping a phone number is not necessarily completing a phone conversation.
Google Analytics can automatically measure web form interactions through form_start and form_submit, and Google recommends the generate_lead event for initial lead acquisition. Google also documents later lead-stage events such as qualify_lead and close_convert_lead, which makes the distinction between an inquiry and a customer especially useful.
A practical measurement sequence is:
form_start → form_submit → generate_lead → qualified lead → appointment → customer
Stage 1: Measurement Accuracy
Before asking why visitors are not converting, ask a more uncomfortable question:
Do we actually know how many leads we are getting?
A business may be receiving:
- Calls
- Forms
- Booking requests
- Emails
- Chats
- Google Business Profile inquiries
- Walk-ins
while its analytics report tells a completely different story.
Signs of a Measurement Leak
Look for:
- Forms arriving by email but not appearing in analytics
- Form events firing more than once
- Phone clicks being reported as completed calls
- Booking completions not being captured
- Spam being counted as legitimate leads
- Calls from different channels mixed together
- Sales data living separately from marketing data
- CRM totals disagreeing with website analytics
- Revenue reports that cannot be traced back to lead sources
Audit the Full Measurement Chain
| Measurement Point | What to Confirm |
| Landing-page visit | Is the correct page being tracked? |
| Form start | Did the visitor begin interacting? |
| Form submission | Was a submit action recorded? |
| Successful lead | Did the business actually receive the inquiry? |
| Phone click | Did someone tap the number? |
| Connected call | Did an actual conversation happen? |
| Booking | Did the scheduling process complete? |
| Qualification | Was the lead a genuine fit? |
| Sale | Did the opportunity become revenue? |
Google Analytics provides form-funnel reporting built around page views, form_start and form_submit, while its recommended event framework allows businesses to track later lead stages separately.
Form Submit Is Not the Same as Qualified Lead
This distinction is easy to miss.
A form_submit event may represent:
- A genuine customer
- Spam
- A job inquiry
- A vendor solicitation
- An existing customer
- A duplicate submission
- A technically misfired event
So do not use:
form submissions = successful marketing
as your only performance metric.
Connect analytics with actual lead records.
Phone Click Is Not the Same as Phone Lead
Likewise:
Phone click ≠ connected call ≠ qualified call ≠ booked customer
If phone leads matter to the business, use the appropriate call-tracking and CRM process to understand what happened after the tap.
Fix Stage 1
- Test every form manually
- Confirm successful submissions fire correctly
- Separate form attempts from real leads
- Track phone clicks separately from calls
- Connect booking confirmations where possible
- Define key lead events clearly
- Remove spam and test data
- Preserve original traffic source
- Connect marketing data with CRM or sales outcomes
Do not redesign the website until you trust the measurement.
Stage 2: Traffic Quality
Traffic can grow while buying intent falls.
That sounds contradictory until you look at where the growth came from.
Imagine two scenarios.
Scenario A
Your website gains 5,000 additional visitors to educational blog articles.
Scenario B
Your website gains 500 additional visitors to high-intent service and location pages.
Scenario A produces more traffic.
Scenario B may create more immediate revenue opportunity.
That is why session volume alone is a poor commercial KPI.
Ask Where the Traffic Growth Happened
| Traffic Growth Source | Immediate Lead Expectation |
| Educational blog content | Usually lower |
| Service page | Higher commercial opportunity |
| Location/service-area page | Higher local opportunity |
| Paid landing page | Strong conversion expectation |
| Branded search | Often stronger existing intent |
| Generic informational search | Usually earlier-stage |
| Irrelevant geography | Low commercial value |
Traffic growth is useful only when you understand its intent.
Questions to Ask
- Are visitors inside your real service area?
- Which pages gained traffic?
- Which search queries drove the increase?
- Are paid clicks coming from relevant search terms?
- Are visitors looking for the service you actually sell?
- Which channels produce qualified leads?
- Which traffic sources produce revenue?
Common Traffic Quality Problems
Blog Traffic Increased but Leads Did Not
This may be completely normal if most growth came from informational searches.
Instead of declaring SEO a failure, create logical pathways from relevant educational content to:
- Service pages
- Location pages
- Consultation options
- Related buyer guides
Traffic Comes From Outside the Service Area
For a local company, geographic mismatch can inflate traffic without improving revenue.
Review SEO and paid targeting.
Ads Generate Clicks but No Qualified Leads
Audit:
- Search terms
- Keyword match
- Audience targeting
- Location settings
- Offer
- Landing-page match
Do not judge paid media by click-through rate alone.
Fix Stage 2
Prioritize traffic matching:
right customer + right location + right service + right problem + right buying stage
Then compare qualified lead rate by channel, not just sessions.
Stage 3: Search Intent and Landing-Page Match
A visitor arrives with an expectation.
The landing page either confirms that expectation or makes the visitor wonder whether they clicked the wrong result.
Consider:
“Why is my air conditioner leaking?”
versus:
“Emergency AC repair near me”
The first visitor may want education.
The second probably wants help.
Sending both to exactly the same generic homepage wastes intent.
Match Intent to the Right Page Experience
| Search Intent | Example | Likely Useful Destination |
| Informational | Why is my AC leaking? | Educational guide |
| Problem solving | AC running but not cooling | Diagnostic/service content |
| Commercial investigation | Best HVAC company near me | Local service or comparison page |
| Transactional | Book AC repair today | Booking-focused service page |
| Navigational | Company name + location | Homepage or location page |
This is not a rigid law.
The actual page should match what the user is trying to accomplish.
Use the Five-Second Test
A high-intent visitor should quickly understand:
- What do you offer?
- Who is it for?
- Where do you provide it?
- Why should I trust you?
- What should I do next?
If they cannot answer those questions quickly, the page has an intent or messaging problem.
Fix Stage 3
For each high-traffic landing page:
- Identify its dominant search intent
- Compare the opening message with the query
- Match CTA strength to visitor readiness
- Link educational content to relevant commercial pages
- Add useful local context
- Remove unrelated competing offers
- Review paid campaigns landing on generic pages
Stage 4: Message and Offer Clarity
Many websites technically explain their services while saying almost nothing memorable.
Common phrases include:
- Innovative solutions
- Results-driven strategies
- Exceptional customer care
- Your trusted partner
- High-quality services
- Personalized solutions
None of those statements answers:
What exactly will you do for me?
Make the Message Specific
| Weak Message | Clearer Message |
| We help businesses grow | We help local businesses turn search traffic into qualified leads |
| Complete home solutions | Same-day plumbing repair for homeowners in North Jersey |
| Digital marketing experts | SEO, PPC and conversion strategy for local service businesses |
| Contact us today | Request a written estimate |
| Personalized healthcare | Book a new-patient consultation |
Specificity reduces cognitive friction.
Your Commercial Page Should Clarify
The Problem
What is the customer trying to solve?
The Service
What do you actually provide?
The Audience
Who is the service designed for?
The Geography
Where is it available?
The Value
What outcome or benefit is the customer pursuing?
The Process
What happens after they inquire?
The Next Step
What should they do now?
Above-the-Fold Clarity Test
On a mobile screen or first desktop view, can a relevant customer identify:
Service + Audience + Location + Credibility + CTA
without scrolling through five generic sections?
If not, improve clarity before changing button colors.
Stage 5: Trust and Local Credibility
A visitor can understand your offer perfectly and still decide:
“I am not sure I trust this company.”
That is a different leak.
For local businesses, trust often comes from evidence that the company is:
- Real
- Relevant
- Experienced
- Available
- Established in the market it claims to serve
Useful Trust Signals
Depending on the business, this may include:
- Recent customer reviews
- Detailed testimonials
- Case studies
- Real team members
- Real project/location photography
- Professional credentials
- Licenses where relevant
- Clear contact information
- Genuine service-area information
- Business hours
- Clear process
- Transparent guarantees or policies
For Google local visibility, Google currently describes relevance, distance and prominence as the main local-ranking factors, with complete business information and reviews among the inputs that can help customers and Google understand a business.
For conversion purposes, however, the simpler question is:
Does the visitor have enough evidence to feel comfortable contacting you?
Put Proof Near the Decision
A glowing review hidden on /testimonials/ does not help much if someone hesitates on the service page.
Place relevant evidence near:
- CTAs
- Pricing discussions
- Service explanations
- Contact forms
- Booking sections
Trust Audit
| Element | Weak | Stronger |
| Review | “Great service!” | Specific service and customer experience |
| Team | No names | Real people and roles |
| Location | City in footer only | Clear service-area explanation |
| Case study | “Results improved” | Problem, strategy and evidence |
| Process | “Contact us” | Clear next steps |
| Contact page | Form only | Form, phone, email and expectations |
Stage 6: Conversion-Path Friction
Sometimes the visitor is qualified, understands the service and trusts the company.
Then the website makes it annoyingly difficult to become a lead.
That is friction.
Mobile Usability
Check the full journey on an actual phone.
Can users:
- Read the page comfortably?
- Tap the phone number?
- Reach the CTA?
- Complete the form?
- Use the booking system?
- Close popups?
- Understand error messages?
Do not audit mobile conversion from a desktop browser window alone.
Page Performance
Slow or unstable pages can add friction to the buying journey.
The goal is not to chase speed scores for decoration.
The goal is to remove delays that make users abandon an action they were ready to complete.
CTA Visibility
A CTA should make the next step obvious.
Compare:
| Generic CTA | More Specific CTA |
| Submit | Request My Estimate |
| Contact Us | Schedule a Consultation |
| Learn More | See What the Service Includes |
| Click Here | Check Appointment Availability |
| Send | Request My Website Review |
Specific CTAs communicate what happens after the click.
Form Friction
Ask only for information needed at that stage.
A first inquiry usually does not need to feel like a mortgage application.
Review:
- Number of fields
- Required fields
- Label clarity
- Mobile inputs
- Error handling
- Confirmation message
- Response expectation
- Alternative contact option
Booking Friction
Test:
- Calendar loading
- Available times
- Time zone
- Confirmation
- Mobile usability
- Reminder flow
Call Friction
Make sure:
- Number is visible
- Mobile number is tappable
- Call routes correctly
- Business hours are clear
- Missed-call process exists
Form Funnel Diagnostic
If:
1,000 people view the page
250 begin the form
30 submit
the page clearly has a different problem than if:
1,000 view
20 begin
18 submit
The first suggests completion friction.
The second suggests an earlier message, intent, trust or CTA problem.
Google Analytics supports analysis using form_start and form_submit, making this distinction measurable when tracking is configured correctly.
Stage 7: Lead Response and Sales Handoff
This is the leak many website audits never reach.
The form works.
The phone rings.
Analytics records the lead.
And revenue still does not move.
Why?
Because lead generation and lead handling are different systems.
Warning Signs
- Calls are missed and never returned
- Forms sit in a shared inbox
- No one owns the lead
- First response takes too long
- Leads receive one attempt and no follow-up
- Staff members use inconsistent qualification criteria
- Marketing source gets lost
- Sales never reports outcomes back to marketing
- Spam and qualified inquiries live in one bucket
A strong landing page cannot compensate for a broken sales handoff.
Audit the Lead Process
| Stage | Question |
| Notification | Who receives the lead? |
| Ownership | Who is responsible? |
| Response | How quickly does contact begin? |
| Qualification | What defines a good-fit lead? |
| Follow-up | What happens if they do not respond? |
| Appointment | Is the next step recorded? |
| Outcome | Is the lead won, lost or pending? |
| Attribution | Is original source preserved? |
| Feedback | Does marketing learn what became revenue? |
Measure Beyond Lead Volume
Calculate:
Visitor-to-Lead Rate
Leads ÷ relevant website visits
Lead Qualification Rate
Qualified leads ÷ total leads
Appointment Rate
Appointments ÷ qualified leads
Close Rate
Customers ÷ qualified sales opportunities
Revenue per Lead
Revenue ÷ total leads
This is where a traffic problem and a sales problem begin to look very different.
Example: Traffic Increased 50%, but Revenue Fell
Suppose a local business compares two months.
| Funnel Stage | Previous Month | Current Month |
| High-intent website visits | 2,000 | 3,000 |
| Leads | 100 | 105 |
| Qualified leads | 60 | 48 |
| Appointments | 35 | 24 |
| Customers | 15 | 9 |
Traffic increased by 50%.
That sounds excellent.
But look deeper.
Visit-to-Lead Rate
Previous:
100 ÷ 2,000 = 5%
Current:
105 ÷ 3,000 = 3.5%
The website is converting a smaller share of relevant traffic.
Lead Qualification Rate
Previous:
60 ÷ 100 = 60%
Current:
48 ÷ 105 ≈ 46%
Lead quality also declined.
Appointment Rate
Previous:
35 ÷ 60 ≈ 58%
Current:
24 ÷ 48 = 50%
Another leak.
Customers
Previous:
15
Current:
9
The traffic report improved.
The business result got worse.
That is why marketing teams should not stop at:
sessions ↑
They need to ask:
Which stage changed?
Conversion Leak Scorecard
Score each stage from 1 to 5.
But do not score based on vibes.
Record evidence.
| Stage | Score | Evidence to Review |
| Measurement | /5 | Analytics vs CRM totals |
| Traffic quality | /5 | Queries, geography, qualified leads |
| Intent match | /5 | Landing-page behavior |
| Message | /5 | Page clarity and CTA engagement |
| Trust | /5 | Proof, reviews and user objections |
| Conversion path | /5 | Form start/submit, mobile, calls |
| Follow-up | /5 | Response, appointments and sales |
Example:
| Stage | Score | Evidence |
| Measurement | 2/5 | CRM shows 45 leads, analytics reports 26 |
| Traffic | 4/5 | Most high-intent visits are in service area |
| Intent | 2/5 | Paid traffic lands on generic homepage |
| Follow-up | 1/5 | 38% of calls go unanswered |
Now the audit produces an action plan rather than another marketing opinion.
What Should You Fix First?
There is only one stage that should almost always come first:
Fix Measurement Before Making Major Decisions
If you cannot trust the data, you cannot confidently identify the leak.
After that, do not blindly fix the remaining stages in numerical order.
Fix the leak affecting the greatest amount of qualified demand.
Example 1
If forms are completely broken:
Fix Stage 6 immediately.
Example 2
If most traffic comes from irrelevant countries:
Fix Stage 2.
Example 3
If 100 qualified leads arrive each month but half never receive a response:
Stage 7 is more urgent than changing a headline.
Example 4
If visitors start the form but almost nobody finishes:
Investigate Stage 6.
The rule is:
Measurement first. Highest-impact verified leak second.
30-Day Conversion Repair Plan
Once the leak is identified, use a focused repair cycle.
| Week | Focus | Actions |
| Week 1 | Measurement | Test forms, calls, bookings and lead events |
| Week 2 | High-intent pages | Improve intent match, headlines, offers and CTAs |
| Week 3 | Trust and friction | Add proof, improve mobile experience and simplify forms |
| Week 4 | Lead handling | Improve qualification, follow-up and sales reporting |
At the End of 30 Days, Compare
- High-intent sessions
- Visitor-to-lead rate
- Qualified lead rate
- Form-start-to-submit rate
- Phone inquiries
- Appointment rate
- Close rate
- Cost per qualified lead
- Revenue by source
- Revenue by landing page where measurable
Then ask:
Did the repaired stage actually improve?
If yes, scale carefully.
If not, investigate the next likely cause.
How Growth Star Digital Can Support the Funnel
Growth Star Digital currently lists services including Web Design & Development, Content Creation, SEO, Social Media Strategy, Paid Advertising, Reputation & PR Management, and Analytics & Reporting. Its website also positions its marketing approach around helping businesses convert traffic into customers rather than treating traffic as the final outcome.
That service mix can support different stages of the conversion journey without inventing a separate service for every leak.
| Business Problem | Relevant Growth Star Digital Service Area |
| Organic traffic is poorly targeted | SEO |
| Paid clicks are not producing good leads | Paid Advertising |
| Landing pages are unclear | Content Creation + Web Design & Development |
| Website experience creates friction | Web Design & Development |
| Marketing data is unreliable | Analytics & Reporting |
| Reputation is weak | Reputation & PR Management |
| Search traffic needs stronger conversion paths | SEO + Content + Website strategy |
The important point is not to buy every service.
It is to identify which part of the funnel is actually broken.
Frequently Asked Questions
Why Do I Have Website Traffic but No Leads?
Common reasons include:
- Traffic from the wrong audience
- Visitors outside your service area
- Informational traffic being mistaken for buyer traffic
- Poor search-intent match
- Unclear offer
- Weak trust
- Hidden CTAs
- Form friction
- Broken tracking
- Slow or inconsistent follow-up
Audit the whole journey before investing in more traffic.
How Do I Know if My Traffic Is Low Quality?
Review:
- Search queries
- Landing pages
- Traffic locations
- Paid search terms
- Channel performance
- Qualified lead rate
- Sales by source
Traffic is commercially weak when large numbers of visitors consistently fall outside the business’s target customer, geography or buying intent.
What Is a Good Website Conversion Rate?
There is no universal conversion rate that applies meaningfully to every local business.
Performance varies with:
- Industry
- Service
- Price
- Traffic source
- Search intent
- Location
- Urgency
- Conversion definition
Compare your own rates by channel and page, especially qualified lead rate, rather than chasing one generic benchmark.
Is a Form Submission a Lead?
It can represent an initial lead, but it should not automatically be treated as a qualified lead.
Google recommends generate_lead for initial lead acquisition and separately supports later-stage lead events such as qualify_lead, reinforcing the usefulness of measuring stages beyond the initial inquiry.
Should I Redesign My Website if It Is Not Generating Leads?
Not automatically.
First audit:
- Tracking
- Traffic quality
- Landing-page intent
- Messaging
- Trust
- CTA visibility
- Form usability
- Mobile experience
- Lead follow-up
Redesign when evidence shows the existing structure is creating a larger problem that smaller repairs cannot solve efficiently.
What Should a Local Business Track in GA4?
Useful website events can include:
- Form starts
- Form submissions
- Initial lead generation
- Phone interactions
- Booking interactions
- Important CTA actions
Google Analytics automatically measures certain form interactions and recommends generate_lead for initial lead acquisition.
Connect those analytics events with actual qualified leads and sales where possible.
Does More Website Traffic Mean More Revenue?
No.
Revenue depends on:
traffic quality × conversion performance × lead quality × sales follow-up
If traffic increases while any of those downstream stages weaken, revenue may remain flat or even decline.
When Should I Hire a Conversion-Focused Marketing Agency?
Consider external support when:
- You cannot identify the leak
- Tracking is unreliable
- Paid traffic is being wasted
- High-intent pages receive traffic but few inquiries
- Website usability is weak
- Marketing and sales data do not connect
- Internal teams cannot determine what to fix first
The agency should be able to explain where the funnel is breaking and what evidence supports that conclusion.
Final Conversion Leak Checklist
Measurement
- Forms are tested
- Successful submissions are tracked
- Phone clicks are separated from actual calls
- Booking completions are measurable
- Spam is excluded
- CRM and analytics totals are compared
- Lead source is preserved
Traffic Quality
- Traffic comes from relevant markets
- Search queries match real services
- Paid search terms are reviewed
- Informational and commercial traffic are separated
- Qualified leads are compared by channel
Intent
- High-traffic pages match dominant search intent
- Paid campaigns use appropriate landing pages
- Educational pages link naturally to relevant services
- Local intent has useful local context
Message
- Service is clear
- Target customer is clear
- Location is clear
- Main benefit is clear
- Process is understandable
- CTA explains the next action
Trust
- Relevant proof appears near conversion points
- Reviews are genuine and useful
- Contact information is complete
- Team/company identity is clear
- Local/service-area information is accurate
Conversion Path
- Mobile journey has been tested
- Pages perform reliably
- CTA is easy to find
- Form is not unnecessarily long
- Error messages work
- Booking tools work
- Confirmation is provided
Lead Handling
- Every lead has an owner
- Response process is documented
- Missed calls are followed up
- Qualification criteria are defined
- Appointments are tracked
- Sales outcomes return to marketing
- Revenue can be connected to source where possible
Do Not Scale a Leak
Traffic is attention.
It is not revenue.
When website visits rise but business results do not, resist the temptation to immediately buy more clicks or publish more content.
First find the leak.
Ask:
Are we measuring correctly?
Are the right people arriving?
Does the page match their intent?
Is the offer clear?
Do they trust us?
Can they contact us easily?
What happens after they become a lead?
Then connect the numbers:
Traffic → Lead → Qualified Lead → Appointment → Customer → Revenue
If the first number rises while the later numbers weaken, traffic growth is hiding the real problem.
Growth Star Digital’s current service mix spans SEO, Paid Advertising, Web Design & Development, Content Creation, Reputation & PR Management, and Analytics & Reporting, which can support different parts of that funnel depending on where the evidence shows the breakdown is happening.
Ready to Find Where Your Funnel Is Leaking?
Getting more traffic without enough qualified inquiries, appointments or customers?
Growth Star Digital can help review the SEO, paid traffic, website experience, content and analytics behind your lead-generation journey and identify which stage deserves attention first.
Find the leak. Repair the path. Then scale the traffic.